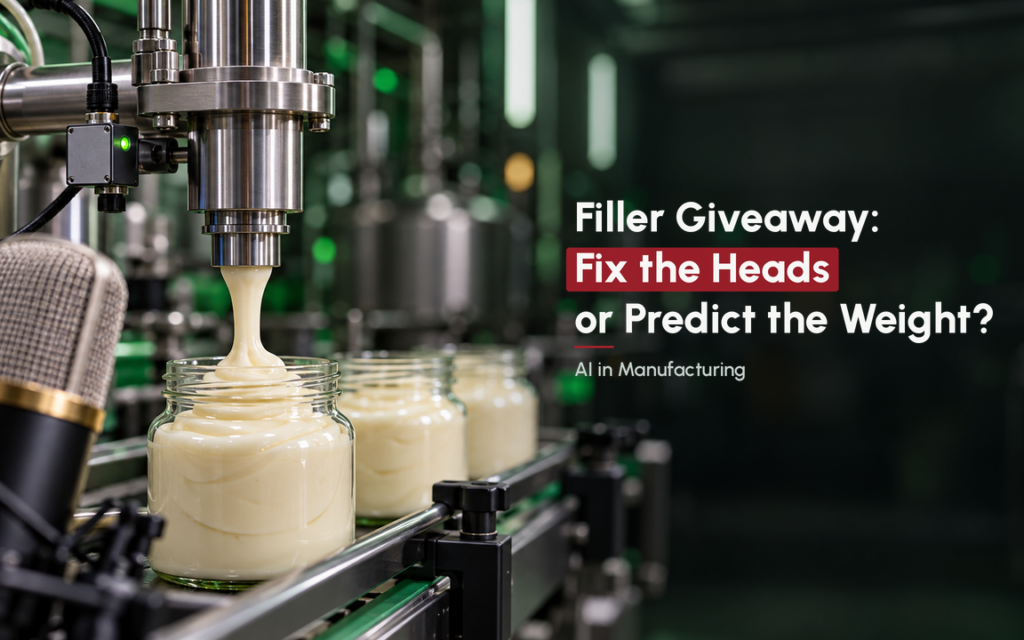
A mayonnaise filling line at a Brazilian plant was putting more product into jars than necessary. Downstream checkweighers corrected fill weights, but each correction arrived after the product had been dispensed.
The plant introduced machine learning to predict weight before filling. It reported a 50% reduction in overfill giveaway on one line.
The right approach depends on where variation begins, how quickly it changes, and whether better control allows the plant to lower its average fill weight safely.
The Brazilian plant addressed upstream variation
Engineers first checked that all filler heads were working properly and delivering similar amounts. A mechanical fault could otherwise be masked by a prediction tool.
With the heads performing similarly, they investigated conditions earlier in production.
The published account of the mayonnaise project describes a 500 g target and an internal scrap window below 499 g and above 508 g.
Engineers used data from filtering, mixing and filling to predict weight before dispensing. They selected measurements most closely linked to fill weight rather than collecting every available PLC tag.
Predictions ran near the filling equipment. The plant reported reduced variation across heads and operation closer to its target.
The account does not establish whether predictions changed filling settings automatically or recommended changes for operator approval. That affects integration and operating procedures.
The reported 50% giveaway reduction applied to one line. Detailed measurements supporting the result were not published.
 Reader offer · ends November 11Where is the hidden cost in your factory?Watch it with 3 months of Premier free →
Lower variation creates room to reduce giveaway
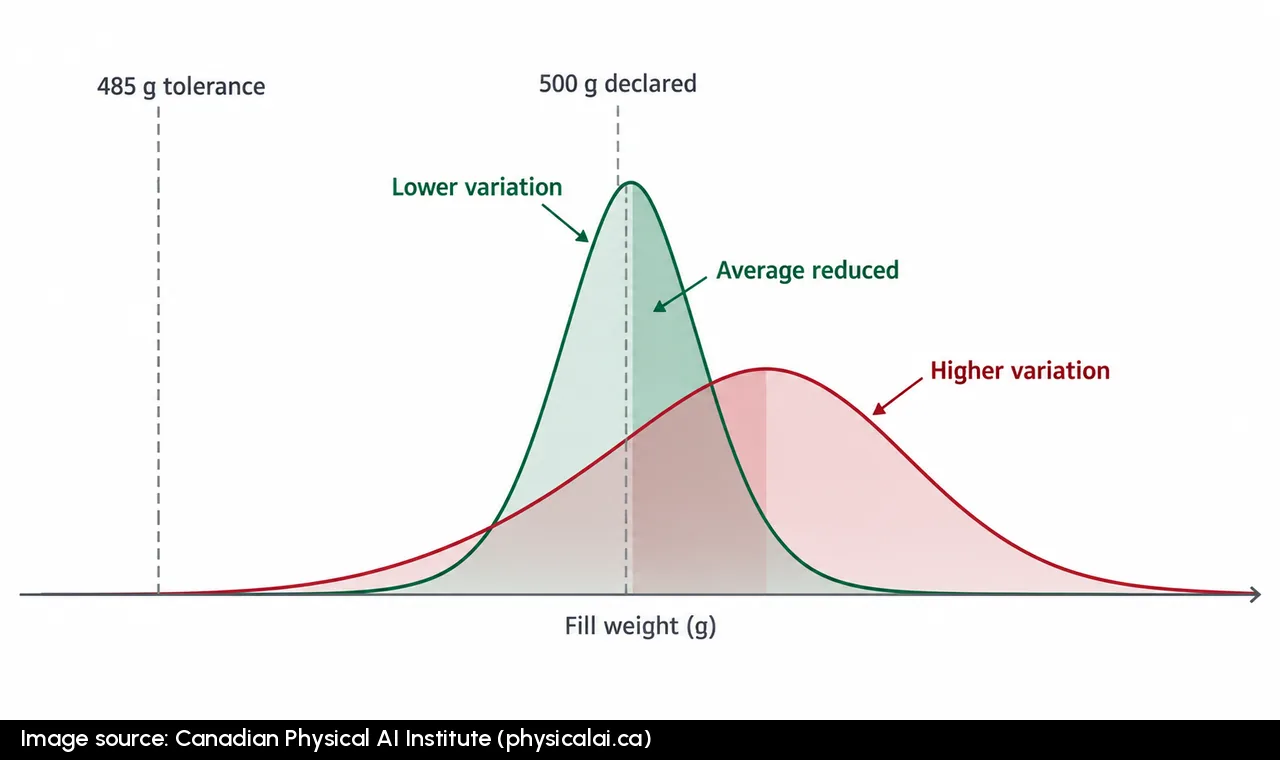
A more consistent filler saves product only when quality assurance approves a lower operating target that maintains acceptable underfill and reject rates.
For Canadian plants, the Competition Bureau’s net-quantity guidance and the Consumer Packaging and Labelling Regulations provide the regulatory context.
For a declared 500 g package, the prescribed negative tolerance is 3%, or 15 g. The lot average must meet the declared quantity. No more than 2.5% of a lot may exceed the 15 g negative tolerance. No more than one package may be short by more than twice that tolerance, or 30 g.
The Brazilian plant’s internal 499 g threshold was much tighter than the Canadian individual-package tolerance. Canadian rules should not be assumed to apply to that operation.
At the reported speed of 320 to 350 jars per minute, lowering average fill weight by 1 g represents 19.2 to 21.0 kg per hour. Over an uninterrupted eight-hour shift, that becomes 153.6 to 168 kg.
These are illustrative quantities, not measured savings. The public account lacks the detailed line data needed to calculate payback.
Filler head differences deserve the first investigation
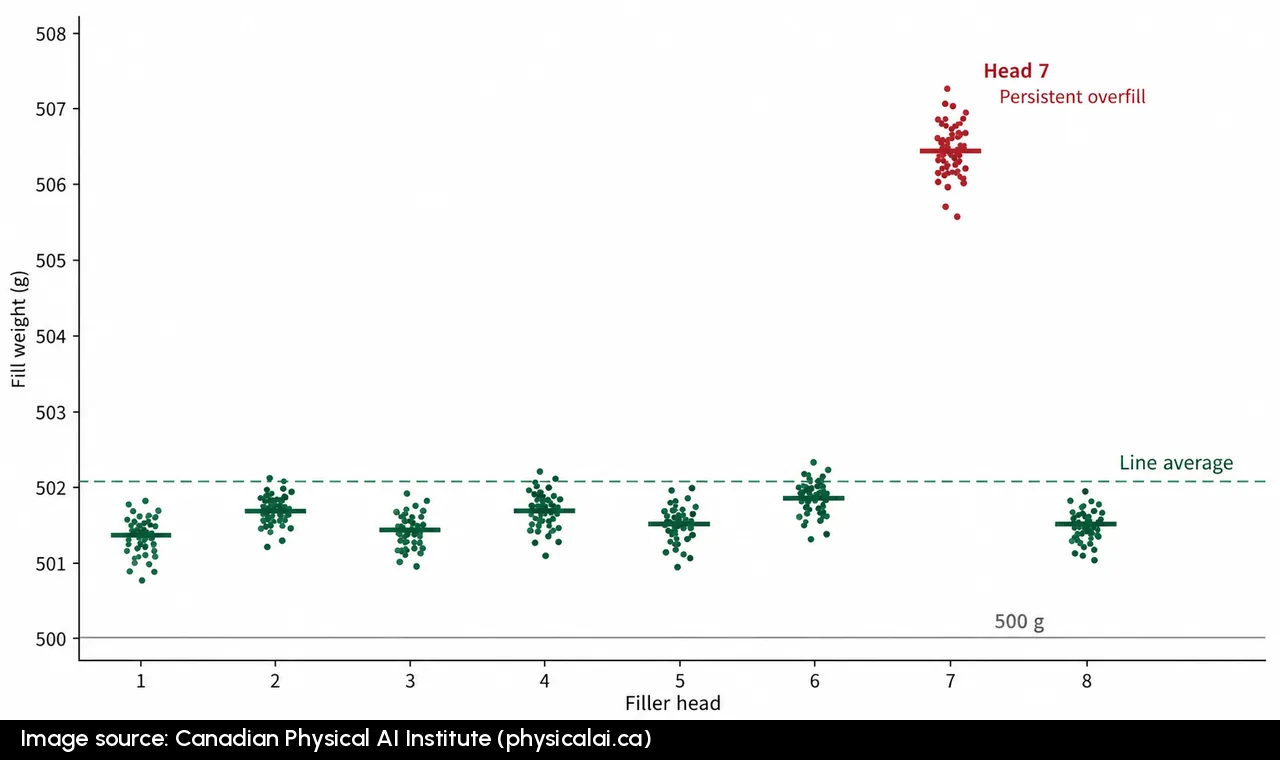
A line can meet its average weight target while an individual head consistently overfills. Line-average control can conceal the fault.
In a Food Engineering article on filling accuracy, an MES engineer identifies sensor calibration as a common cause of persistent overfilling. A packaging engineer recommends checking sensors and calibration before changing control software.
The engineers advise examining weight trends by head. End-of-line weighing detects problems late and may not identify their origin.
An unnamed North American filling line illustrates the financial value of this approach.
The manufacturer reportedly lost $1.0 million to $1.1 million annually through giveaway despite meeting production targets and average fill specifications.
An integrator analyzed 5.1 million fills across 32 heads using fill time, inflight weight, density, flow, temperature and pressure.
The analysis explained more than 90% of historical variation (R² above 0.90). This measured how well it described past behaviour, not giveaway savings.
It identified a head with gradually deteriorating mechanical performance. Repair reportedly delivered an immediate $40,000 to $50,000 benefit.
Expected broader savings were $300,000 to $800,000 per line annually. Those savings were projections. Real-time machine learning control remained planned for a later phase.
The packaging engineer also notes that overfill residue can interfere with sealing. Head-level faults can therefore create additional quality losses.
Conventional feedback can deliver substantial reductions
At a Belgian frozen produce plant, conventional checkweigher feedback substantially reduced excess weight.
A 2025 industry article written by a checkweigher manufacturer reported:
| Packaging line | Excess weight before | Excess weight after | Relative reduction |
|---|---|---|---|
| Line 1 | 0.69% | 0.14% | 80% |
| Line 2 | 0.30% | 0.11% | 63% |
The system monitors average package weight and sends small upstream corrections. The plant extended it to all six small-pack lines.
A technical manager reported stable operation after a few hours of testing and adjustment.
Both relative reductions exceeded the Brazilian plant’s reported 50%, but the results are not directly comparable.
The Belgian lines weigh portions of frozen fruit and vegetables using multiple heads. The Brazilian line dispenses thick mayonnaise into jars. Starting conditions and sources of variation differ.
Conventional feedback is appropriate when process conditions remain stable enough for corrections to catch up. The limitation is the delay between filling, weighing and adjustment.
Transport delay determines when prediction helps
A downstream checkweigher measures packages after filling. Corrections affect subsequent packages while others are already travelling toward the scale.
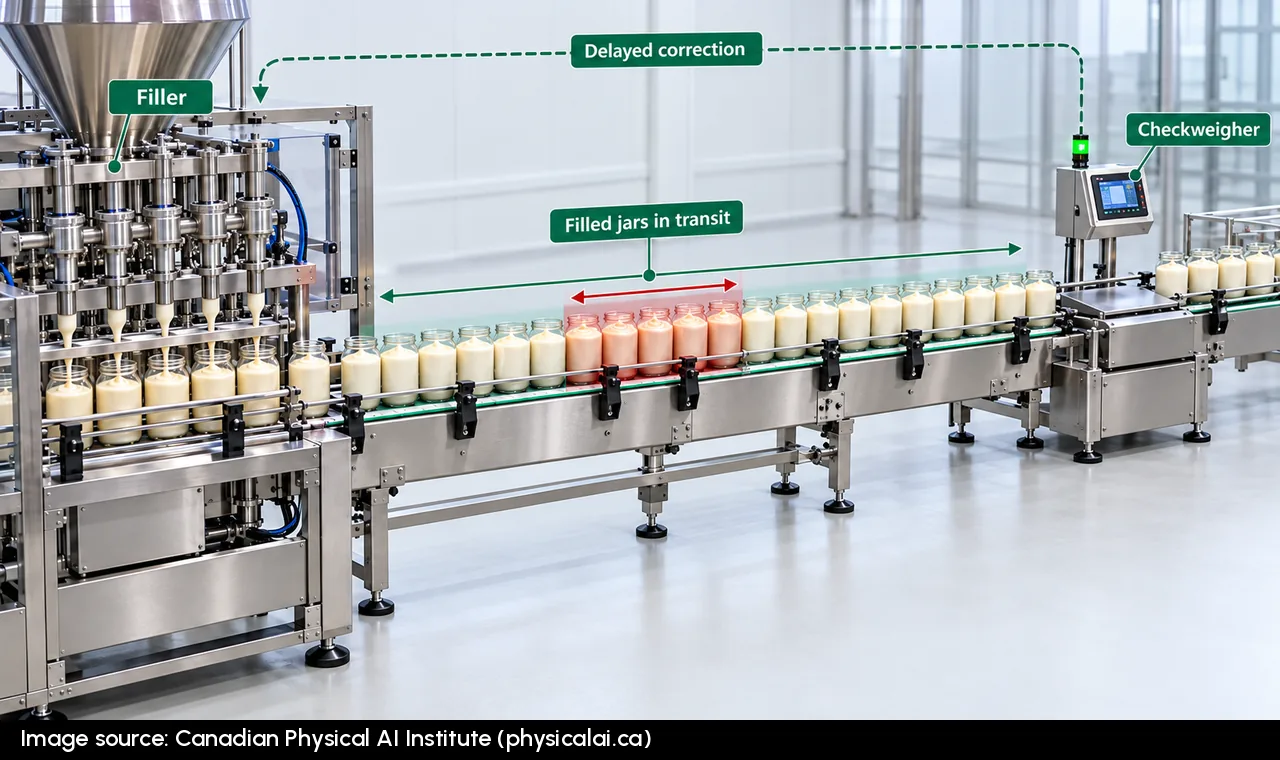
Plants can estimate the quantity affected by this delay using two calculations:
- Count the jars between filler and checkweigher. Divide by line speed in jars per minute to estimate transport time in minutes.
- Multiply that jar count by average grams above target to estimate excess product already committed during transport.
The calculation excludes additional controller response time. It estimates exposure, not recoverable savings.
If upstream conditions change faster than feedback responds, predicting weight before dispensing may reduce variation that downstream corrections cannot catch.
The business case still depends on whether prediction outperforms conventional feedback or simpler predictive methods under comparable production conditions.
Simpler prediction methods can perform well
A 2021 study of an auger powder-filling machine evaluated methods for controlling fill weight.
Researchers used motor torque, temperature and humidity to estimate dispensed powder weight. The controller adjusted auger rotation before each filling cycle ended.
Reported standard deviations were:
| Method | Standard deviation across all data |
|---|---|
| No adjustment | 2.000 |
| Simple prediction using several measurements | 1.466 |
| Neural network prediction | 1.526 |
| Method adjusting as conditions change | 1.335 |
Simple prediction reduced standard deviation by approximately 26.7%. The adaptive method achieved about 33.3%.
Simple prediction delivered roughly 80% of the best method’s improvement.
The more complex prediction method showed a generalization problem. Its standard deviation was 0.955 on development data but 2.046 on separate test data, worse than the 1.863 recorded without adjustment on those test data.
These measurements describe variation on a test machine, not actual food-plant giveaway savings.
Plants should evaluate competing methods on unseen production data, then compare actual giveaway and reject rates before changing operating targets.
Prediction tools bring ongoing operating costs
A 2025 food engineering study examined two years of production data covering 135,849 potato batches and 47 variables.
One machine learning method predicted fat content with an R² of 0.96, while moisture prediction reached only 0.71.
Proposed fryer adjustments were calculated outside live production. No automatic line control was demonstrated.
Researchers warned that raw-material changes could reduce prediction accuracy and require model updates.
Filling applications face similar maintenance requirements. Plants need to check predicted values against measured weights, detect performance drift, update models after product or equipment changes, and support operators.
No cited source establishes a measured payback period for machine learning fill control. A checkweigher supplier claims conventional feedback can pay back within one month or a few months.
Match the investment to the source of variation
Compare individual heads and repair mechanical or calibration faults first.
When heads perform similarly, measure transport delay and determine whether conventional feedback responds quickly enough. Track actual giveaway and rejects before adjusting targets.
Consider prediction when upstream process changes influence fill weight faster than feedback can compensate. Test it against simpler methods using new production data.
Include integration, monitoring and model updates in the investment calculation. Approve lower targets only when measured performance supports them and applicable quantity requirements remain satisfied.