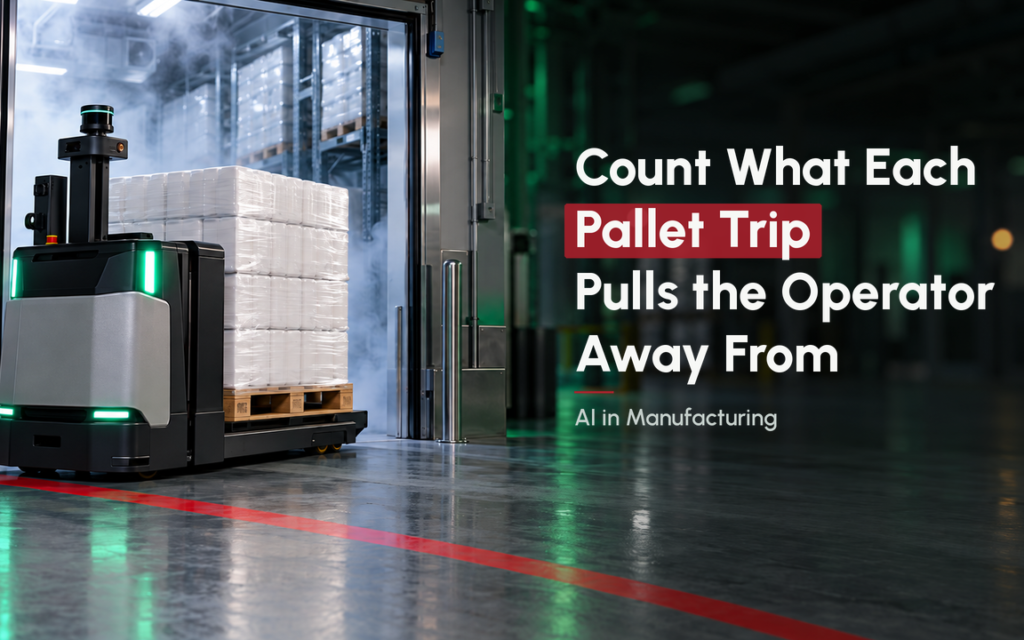
At Fonterra’s Darfield cream-cheese factory in New Zealand, moving a pallet 250 metres to cold storage once required much more than a forklift drive. A production operator crossed a hygiene boundary, removed protective clothing, walked about 100 metres to the distribution centre, drove the pallet 250 metres to cold storage, drove the forklift back, walked back to production and put on sanitised clothing again. Before automation, that complete manual sequence happened 80 to 120 times a day. Each trip pulled someone away from work that still needed attention, including quality checks.
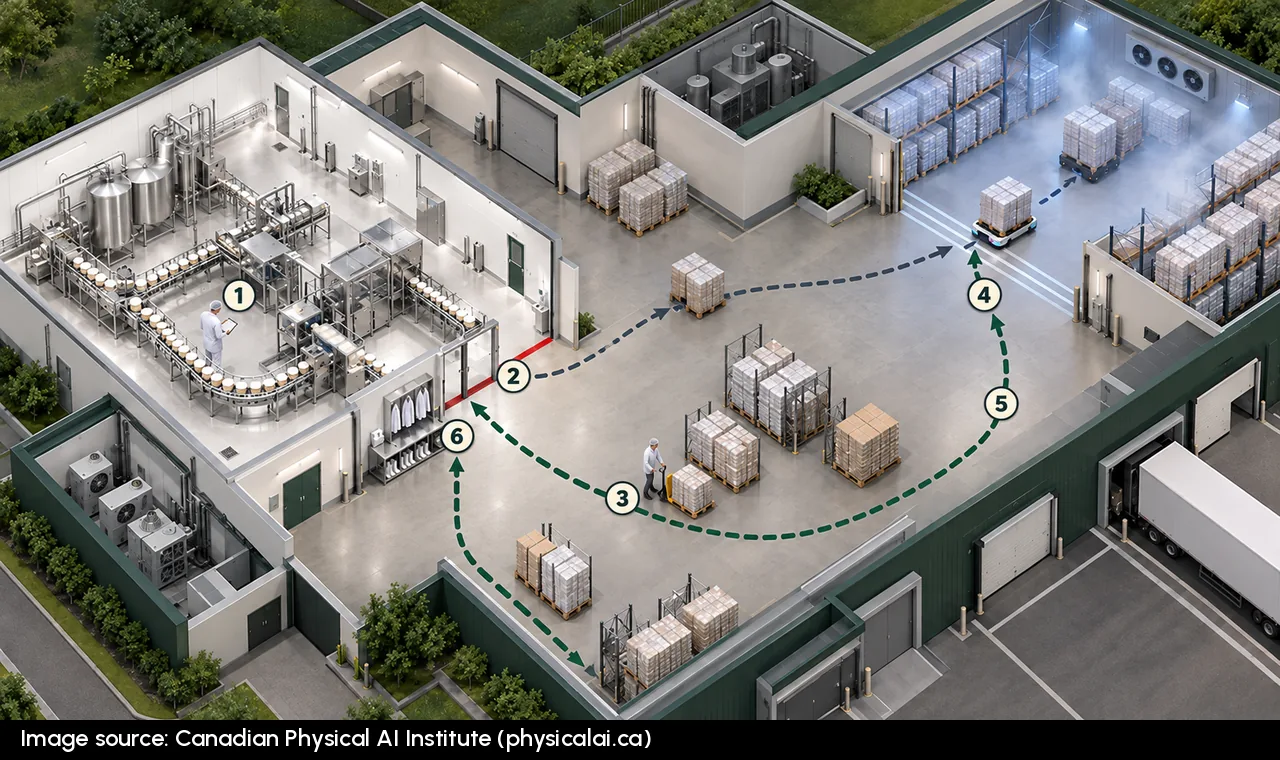
In 2018, two automated guided vehicles (AGVs) took over the transport. The published Darfield account says operators could stay focused on quality checks and production. Plant manager Matt Smith also pointed to safety: reliable pallet storage meant less interaction between operators and forklifts. The lesson is not that a 250-metre route automatically deserves an AGV. It is that the cost of a trip includes the work interrupted at both ends.
Measure the full absence from the original job
Start by choosing one repeated pallet route and following the person, not just the pallet. Begin timing when the operator stops their normal task. Stop only when that person is back in position and ready to perform it again. Include removing protective gear, walking, waiting for a forklift or access door, collecting and delivering the pallet, returning equipment, re-gowning and the time needed to restart the original work.
Watch several trips across normal and busy periods rather than timing one unusually smooth run. Note interruptions separately, such as a blocked lane or delayed door, because a dependable route and a variable one create different automation requirements. A stopwatch and a simple log are enough to begin.
| Record for each observation | What to enter |
|---|---|
| Route, date and shift | Start, destination and time of day |
| Full time away | Minutes from leaving the main task to resuming it |
| Time breakdown | Walking, clothing changes, driving, waiting, restart |
| Work interrupted | Quality check, line watching, adjustment or other task |
| Hygiene boundary | Clothing changes, hand hygiene, airlock or other step |
| Delays or assistance | Door waits, congestion, faults and who responds |
Next, count how often the complete sequence occurs on each shift. Use actual movements, not the theoretical number of pallets the line could produce. If two operators share the route, record who leaves and whether their absences overlap.
Then ask what happens on the line during each absence. Was a quality check delayed, did another operator cover it, or was the original task safely paused? The minutes away are measurable, but their operational cost depends on that answer. Coverage that pulls another person from their own duties may shift the interruption rather than remove it.
To estimate the direct labour cost per trip, multiply the minutes away by the fully loaded hourly labour rate, then divide by 60. Record documented damage, overtime or additional coverage separately, avoiding double-counting. Keep unmeasured production and quality risks visible rather than assigning them invented dollar values.
Finally, mark which steps automation would truly eliminate. An AGV might remove travel and forklift handling but still need someone to clear a fault, open a door or manage a hygiene transfer. Those remaining duties must be included in the comparison.
 Reader offer · ends November 11Where is the hidden cost in your factory?Watch it with 3 months of Premier free →
An illustrative calculation turns trips into operator time
The following are example numbers, not from any plant. Suppose observations show a full absence of 12 minutes per trip, including walking, clothing changes, driving, waiting and restarting work. Suppose the route is used 100 times a day.
100 trips/day × 12 minutes/trip = 1,200 operator-minutes/day.
1,200 ÷ 60 = 20 operator-hours/day away from the original task.
If the illustrative fully loaded labour rate is $40 per hour, those movements account for 20 × $40 = $800 per day in labour time assigned to transport.
That is not $800 of proven daily savings. Some tasks may already be covered, and an automated system still needs oversight and occasional intervention. The next calculation should compare manual time with realistic post-automation operator involvement, using the same daily volume.
For a route proposal, add the practical constraints: complete AGV cycle time, door and transfer delays, charging periods, traffic conflicts and recovery after faults. Check whether the fleet can keep up during the busiest shift. Then compare installation and ongoing costs with the workload and disruption the system can actually remove.
Three route patterns point to different automation opportunities
-
A hygiene-bound trip repeatedly interrupts skilled production work. Fonterra fits this pattern because each short pallet movement required leaving a controlled area and later re-entering it, taking operators away from quality checks. The key measure is the full interruption and how consistently automation prevents it.
-
A busy warehouse lane strains staffing, handling and night coverage. At Valio’s Haapavesi cheese plant, a supplier-published account reports forklift operators falling from eight to four, manual shifts from three to two and handling damage down 90%, alongside unattended overnight operation. Those are supplier-reported outcomes without a stated measurement method for damage, not targets to assume for another warehouse.
-
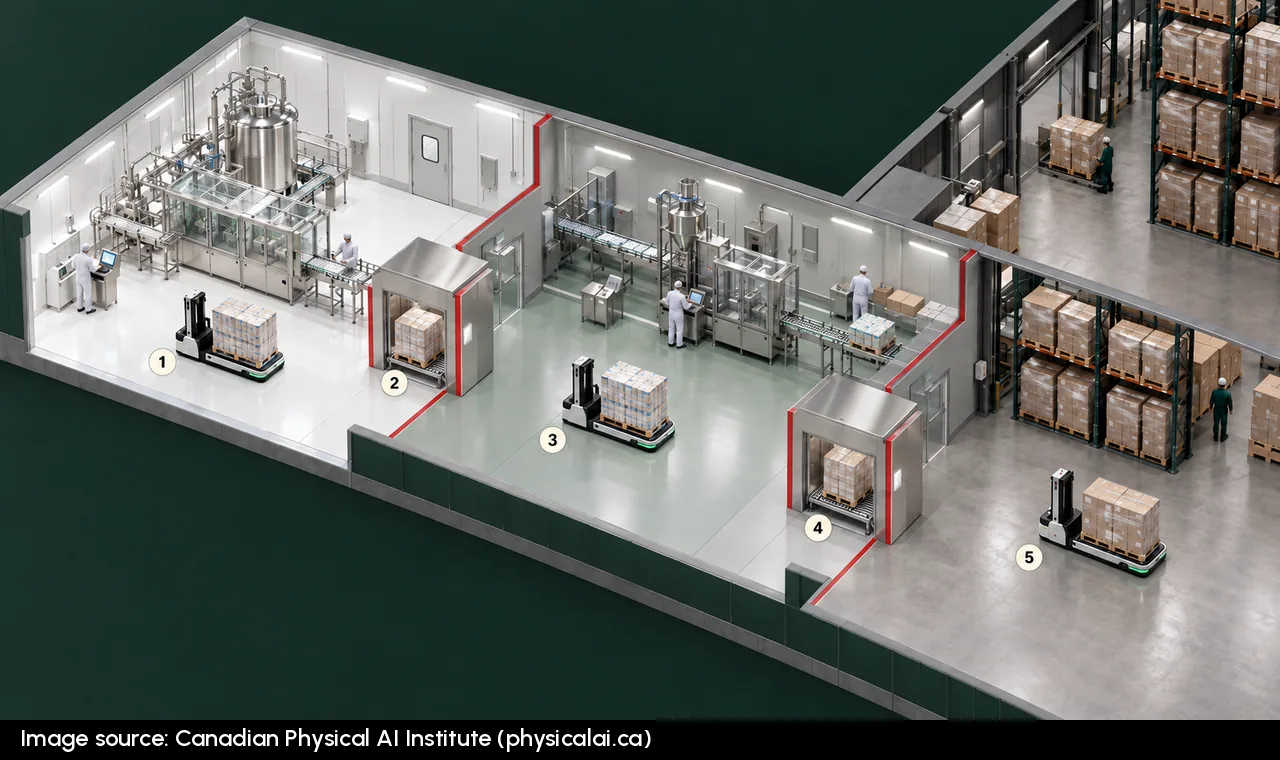
A route crosses hygiene zones that should remain separate. At Ausnutria’s Heerenveen infant-nutrition facility, four AGVs deployed in 2025 served dedicated zones, passing materials through airlock handoffs rather than sending each vehicle through every boundary. The reported capability of up to 12 pallets an hour describes throughput, not verified labour or contamination savings.
These cases show why vehicle selection should follow an understanding of the work. Fonterra’s opportunity lay in protecting operators’ attention, Valio’s in warehouse coverage and handling, and Ausnutria’s in redesigning material transfers between hygiene zones.
Choose a solution that preserves hygiene and safe operation
In Canadian plants, Section 59 of the Safe Food for Canadians Regulations addresses controlling the movement of people and things to prevent contamination. This makes hygiene boundaries part of route design, not a detail to handle after vehicle selection. ISO 3691-4:2023 addresses safety requirements for driverless industrial trucks, providing another check where vehicles share space with people and other equipment.
Make the decision from a short evidence pack: observed full-trip time, trips by shift, work displaced, hygiene steps, anticipated interventions and a credible automated cycle. Use that information to compare an AGV with other changes, such as a better transfer point or a conveyor on a fixed high-volume route.
Start with the interruption log, then test whether a real design can remove that burden without creating new work at doors, hygiene boundaries or fault calls. That gives managers a practical basis for choosing which pallet routes deserve investment.