An AI pilot is not ready when the demo works.
It is ready when operations, QA, maintenance, sanitation, engineering, and IT/OT know exactly what happens when the system is wrong.
That is the test many food and beverage plants skip. A camera detects the defect, but the reject timing is off. A model flags a downtime risk, but no one owns the alert. A forecasting tool improves demand visibility, but ignores allergen sequencing, tank limits, or shelf-life exposure.
The technology may work. The plant system around it may not.
This guide is for Canadian food and beverage plant leaders evaluating AI, robotics, machine vision, analytics, or automation. It will help you decide whether a use case is ready for production conditions, or whether the plant needs to fix data, workflow, ownership, sanitation, or measurement first.
In this guide, you’ll learn how to:
- Decide which AI and automation use cases are ready to pilot first
- Identify hidden gaps in data, ownership, sanitation, and QA workflow
- Avoid pilots that create more review work than plant-floor value
- Build a practical readiness checklist before buying or installing technology
- Measure success using OEE, downtime, yield, labour, QA, and ROI
- Know when to scale, extend, or pause a pilot
1. The Use Case Is Ready Only When the Plant Knows the Next Action
A useful AI pilot begins with a specific production decision.
Not a feature. Not a dashboard. Not a vendor capability.
The question is: what decision will this system help the plant make faster, earlier, or with better evidence?
For example, “use machine vision for quality” is too broad. A stronger use case is:
Detect seal contamination on tray line 2 before affected product reaches case packing, then give QA a clear image record, affected time window, and disposition path.
That use case has a production location, a defect type, an action, and a business reason.
The same discipline applies to robotics, forecasting, and anomaly detection.
| Broad Idea | Production-Ready Use Case |
|---|---|
| Use AI for downtime | Detect early vibration changes on pump group A after CIP and trigger a maintenance check before failure |
| Use vision for inspection | Verify date-code readability by SKU and reject only confirmed unreadable packs |
| Use robotics for packing | Automate repetitive case loading where product presentation is stable across the top 5 SKUs |
| Use AI for planning | Recommend production sequences that respect allergens, shelf life, tank capacity, and packaging availability |
The hidden issue is that many pilots fail before the model is even built. The project team cannot define the decision clearly enough.
If the plant cannot explain what should happen after the system flags a problem, the pilot is not ready.
Ask your team:
- What action will change because this system exists?
- Who takes that action on days, nights, weekends, and after changeover?
If those answers are vague, keep refining the use case before spending money.
2. A Good Pilot Removes a Measurable Loss, Not Just a Manual Task
Manual work is not automatically a good automation target.
Some manual work exists because the upstream process is unstable. Automating that task may lock in the instability instead of removing it.
A robot at the end of a line will struggle if cases arrive twisted, crushed, poorly spaced, or mixed without tracking. A vision system will create nuisance rejects if lighting, product presentation, and reject timing are not controlled. An anomaly model will produce noise if startup, steady-state, CIP recovery, and changeover are all treated as the same operating condition.
Before selecting the tool, define the loss in plant language.
| Production Loss | Better Pilot Target |
|---|---|
| Excess giveaway after startup | Reduce filler variation during the first 20 minutes after sanitation |
| Slow manual label checks | Verify correct label, date code, and barcode readability at line speed |
| Repeated sealer stops | Detect drift in temperature, pressure, dwell time, and film tracking before downtime |
| Labour pressure in packing | Automate predictable case loading after product spacing and accumulation are stable |
| Long QA holds | Connect inspection evidence, lot scope, operator action, and QA disposition in one record |
The mistake to avoid is choosing the most impressive technology instead of the most defensible use case.
A practical first pilot should meet three conditions:
- The loss is already visible in plant metrics.
- The line team agrees the problem is worth solving.
- The system output leads to a clear action.
If the loss cannot be measured, the ROI will become a debate. If the action is unclear, the pilot will become another screen people stop checking.
3. Before Buying, Check the Data Behind the Decision
AI does not need perfect data, but it does need the right context.
A checkweigher reading means little without SKU, filler head, recipe, line speed, product temperature, and production state. A camera reject means less if it is not tied to the lot, lane, reject reason, image, operator action, and final disposition. A downtime alert is weak if maintenance notes use broad codes like “machine issue” or “adjusted sensor.”
The problem is not usually “bad data.” That phrase is too general.
The real problems are more specific:
- Asset names do not match between PLC, historian, CMMS, and MES
- Timestamps are not aligned across systems
- Downtime codes are reused for unrelated failures
- QA notes live in spreadsheets, binders, or free-text fields
- Product state is missing, especially startup, changeover, CIP recovery, and steady-state operation
- Rejects are counted but not classified
- Maintenance actions are recorded after the fact without failure-mode detail
Before buying software or hardware, run a data readiness review around one production question.
| Pilot Goal | Data Required | Common Gap |
|---|---|---|
| Predict sealer failures | Temperature, pressure, dwell time, speed, faults, film data, work orders | Maintenance records do not identify failure mode |
| Reduce giveaway | Checkweigher data, SKU, filler head, recipe, product temperature, speed | Weight data is not tied to lane or product state |
| Improve label inspection | Vision result, label version, SKU, lot, reject image, operator response | Rejects are counted but not categorized |
| Detect process drift | Sensor trends, batch phase, CIP state, raw material lot, line speed | Startup and steady-state data are mixed |
| Improve scheduling | Orders, inventory, shelf life, changeovers, allergens, yield, packaging | Planning data ignores real line constraints |
A useful test is simple:
Can the data explain the difference between a normal run, a bad run, and a run that looked bad for an acceptable reason?
If not, the plant may need a data cleanup project before an AI project.
That is not a delay. It is risk reduction.
4. Machine Vision Fails When the Camera Is Treated as the Whole Project
Machine vision is strongest when the inspection is fast, repetitive, and risky to perform manually.
Good first targets often include date-code readability, label presence, cap placement, fill level, seal contamination, barcode readability, case count, packaging orientation, and visible product defects.
The camera is rarely the hard part.
In food plants, the real work is lighting, washdown protection, SKU variation, reject timing, operator recovery, and QA disposition. If the system detects the defect but rejects the wrong pouch, you do not have a camera problem. You have an integration problem.
Before installing vision, confirm:
- Camera location and working distance
- Lighting angle, colour, glare control, and enclosure
- Lens protection during washdown
- Trigger timing from the PLC, encoder, or sensor
- Reject timing at actual line speed
- Fail-safe behaviour when the camera faults
- QA review process for borderline cases
- Operator steps for cleaning, restart, and override
A common mistake is using vision only as a pass/fail gate.
A stronger approach is to treat it as a process sensor.
For example, if seal rejects rise on lane 2 after sanitation, the value is not just “bad packs removed.” The better insight is that contamination may be tied to startup conditions, product temperature, depositor splash, film tracking, or equipment warmup.
| Example | Better Use of Vision Data |
|---|---|
| Seal contamination on tray packs | Trend rejects by lane, product, temperature, film roll, and time since sanitation |
| Wrinkled labels on bottles | Compare reject patterns by label supplier, humidity, applicator setup, and speed |
| Unreadable date codes | Tie rejects to printer condition, ink or ribbon, trigger timing, and packaging surface |
Vision should not create a pile of images no one reviews.
It should help the plant isolate the cause, define the affected product, and support a cleaner QA decision.
5. Robotics Should Be Judged by Recovery, Not Just Pick Rate
A robot that performs well in a clean demo can still frustrate production.
The real test is what happens after a short stop, missed pick, crushed case, pallet change, SKU change, approved cell entry, or upstream surge.
Robotics often works best first in secondary packaging, case packing, palletizing, depalletizing, carton handling, and end-of-line stacking. These areas usually have less direct product risk and more predictable handling.
But the arm is only one part of the system.
A reliable robot cell depends on product presentation, end-of-arm tooling, accumulation, guarding, safety, sanitation access, fault recovery, and maintenance support.
Before approving a robotics pilot, ask:
- Is product position repeatable at production speed?
- Are cases square, sealed, and spaced consistently?
- Can the cell recover without engineering support?
- How often does the pallet pattern or SKU format change?
- Can sanitation clean around the cell without creating traps?
- Can maintenance access sensors, tooling, guards, and utilities?
- What happens when upstream equipment stops and restarts?
The end-of-arm tool can make or break the business case.
Vacuum may work on sealed cartons but struggle with porous board, dusty surfaces, freezer frost, or flexible bags. Mechanical gripping may be more reliable, but it can add changeover time or damage softer products.
For direct food handling, the bar is higher. Product variability, allergen risk, hygienic design, cleaning, material compatibility, and gentle handling all become part of the decision.
The practical question is not, “Can the robot pick it?”
The better question is:
Can the full cell pick it, place it, clean it, change it over, recover from faults, and keep running at production speed?
If the answer is uncertain, validate the cell around the messy conditions first.
6. Forecasting Must Respect the Constraints the Floor Cannot Ignore
Forecasting tools can reduce short runs, schedule churn, ingredient waste, overtime, and unnecessary inventory.
They can also create friction if they recommend a schedule the plant cannot physically run.
A useful planning model needs more than orders and shipments. It should understand the constraints that shape real production.
That may include:
- Allergen sequencing
- Shelf-life exposure
- Tank capacity
- Packaging availability
- Ingredient lead times
- Line qualification
- Changeover time by product family
- Sanitation windows
- Yield by SKU or campaign
- Cold storage or WIP capacity
A model that ignores these constraints may improve forecast accuracy while making the schedule worse.
That is the planning trap.
Forecast accuracy is not enough. The plant needs to know whether the forecast improves a decision.
For example:
| Planning Decision | Useful AI Output |
|---|---|
| Extend or split a campaign | Expected demand, shelf-life risk, changeover cost, and inventory exposure |
| Prioritize a constrained ingredient | SKU margin, customer risk, expiry window, and production feasibility |
| Build ahead before a promotion | Capacity impact, storage limits, packaging readiness, and spoilage risk |
| Sequence allergen runs | Demand priority, sanitation requirement, and line qualification |
Measure the tool by schedule stability, waste reduction, changeover reduction, service level, and inventory quality.
A forecast that looks accurate but creates impossible production plans is not a plant-ready forecast.
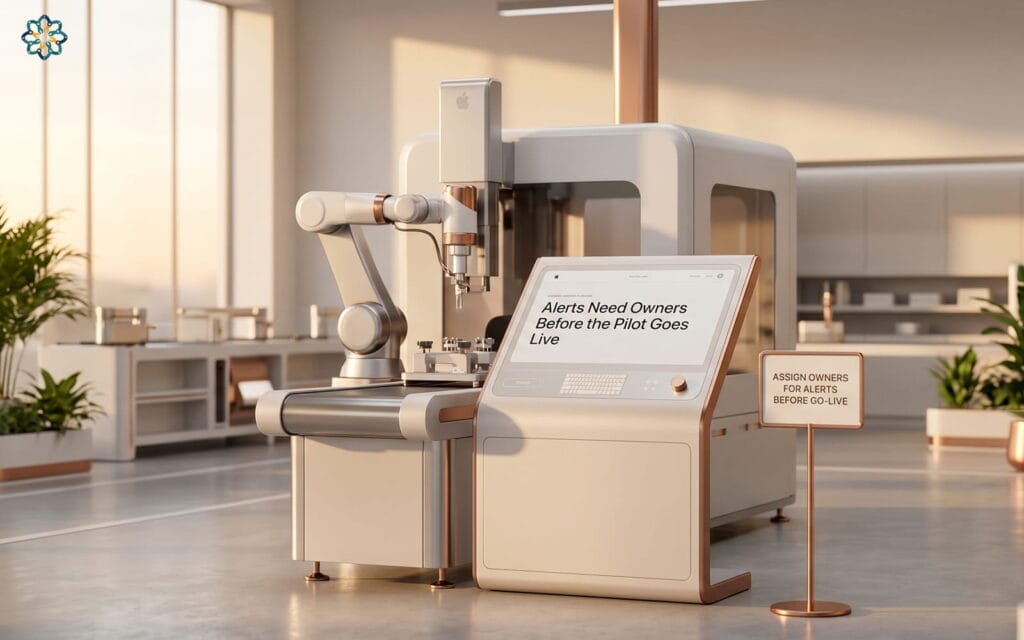
7. Alerts Need Owners Before the Pilot Goes Live
Anomaly detection can be valuable because it finds patterns that fixed alarms miss.
A standard alarm says a value crossed a limit. An anomaly model says the pattern no longer matches expected behaviour for this operating condition.
That distinction matters in food production. Normal during startup may be abnormal during steady-state operation. Normal after CIP may be abnormal four hours into a run. Normal for a viscous product may be abnormal for a thin product.
Segment the model by production state before trusting the alerts.
Useful segments may include:
- Startup after sanitation
- Steady-state production
- Changeover recovery
- Pre-CIP and post-CIP operation
- Product family or viscosity
- Short run versus long campaign
- Normal production versus recovery after a stop
The hidden failure mode is not always false alarms. It is alerts without ownership.
If an anomaly model sends vague warnings to a dashboard, it will lose credibility quickly.
Every alert needs a response rule.
| Alert Type | Owner | Required Action |
|---|---|---|
| Pump vibration pattern changes after CIP | Maintenance | Inspect seal, alignment, bearing condition, and mounting |
| Filler head trends low after startup | Operations and QA | Check setup, product temperature, adjustment history, and affected product |
| Freezer performance drifts | Maintenance and QA | Check airflow, defrost cycle, door condition, and product temperature records |
| Seal defects rise on one lane | Operations, QA, Maintenance | Hold affected window, inspect depositor, film tracking, and jaw condition |
An alert is only useful if it gives the team enough warning to act.
Back-test against known events before launch. If the model would not have helped the plant intervene earlier, keep tuning the use case.
8. Food Safety Value Comes From Evidence, Not More Dashboards
AI can support food safety, traceability, and CFIA or customer audit readiness, but only when it creates records QA can trust.
Detection alone is not enough.
A useful quality record answers:
What happened, when did it happen, what product was affected, who acted, and what evidence supports the decision?
A camera reject, weight trend, temperature deviation, or model alert should connect to product context and disposition.
| Weak Record | Stronger Record |
|---|---|
| “Code failed” | Code unreadable, camera 2, lane 3, time, SKU, lot, image saved, reject confirmed |
| “Low weights” | Filler head 6 trending low, sample count, product temperature, speed, adjustment made |
| “Bad seal” | Seal contamination detected, lane 2, image stored, film roll ID, affected time window |
| “CIP issue” | Rinse temperature below target, circuit affected, startup hold applied, QA disposition recorded |
| “Reject event” | Detector status, reject confirmation, product isolated, investigation record, final disposition |
The record should also show system version, model version, threshold settings, and inspection limits.
That detail matters when a camera moves, a threshold changes, a model is updated, or a label format changes. Without version history, older records become harder to defend.
Traceability also needs lot logic, not just data storage.
If a label inspection fails for six minutes, the affected product window may not be exactly six minutes. Conveyor length, accumulation, pack-off, case packing, palletizing, and WIP between inspection points all affect the actual scope.
The practical traceability question is:
Can we define the affected product accurately without holding more product than necessary?
Better records help QA narrow the hold, review evidence faster, and support cleaner release, rework, or rejection decisions.
AI should not replace QA authority. It should make QA decisions easier to verify.
9. Sanitation and Maintenance Can Break a Technically Correct Design
A pilot that works before washdown has not proven enough.
Food plant automation has to survive cleaning, inspection, teardown, reassembly, condensation, chemicals, wet floors, and startup after sanitation.
A component rating is not the whole answer. The installed system must be cleanable, inspectable, drainable, and maintainable in the actual sanitation routine.
Common design misses include:
- Cameras mounted where foam collects
- Flat brackets that hold water
- Robot bases that create floor traps
- Cables routed through splash or traffic zones
- Sensors that fog, corrode, or shift after cleaning
- Guards that slow sanitation or make pre-op inspection harder
- End-of-arm tooling that is difficult to remove, clean, and reinstall consistently
Before hardware is ordered, sanitation, QA, maintenance, operations, and engineering should review the layout together.
Check:
- Product contact versus non-product contact zones
- Wet washdown, dry clean, or low-moisture requirements
- Exposure to foam, sanitizer, caustic, acid, and high-pressure spray
- Drainage around frames, bases, guards, and supports
- Access for pre-op inspection
- Time added to cleaning and reassembly
- Parts that may need calibration or verification after sanitation
- Safe access for maintenance on nights and weekends
CIP should also be part of the pilot, not treated as a gap between production runs.
For process monitoring, capture pre-CIP state, CIP sequence, rinse, drain, startup, and first-good-product period. For vision, test the first run after sanitation, when lenses may fog and equipment may still be warming or drying. For robotics, confirm whether cleaned and reinstalled tooling returns to the same position.
A small sanitation-related shift can create a large production problem.
Design for the cleaning routine the plant actually uses.
10. The Pilot Must Feed Continuous Improvement, Not Sit Beside It
A pilot that finds problems but does not change plant action is only reporting.
The output should connect to daily production meetings, downtime reviews, RCA, PM planning, QA holds, changeover improvement, sanitation review, and capital planning.
The practical test is:
Does this system help the team find, prioritize, fix, and verify a real loss?
For example, a vision system may show that seal defects rise within eight minutes of a film roll change. That insight should not stay inside the vision software.
It should trigger a review of film tension, operator setup, supplier variation, jaw temperature, startup checks, and sampling frequency.
A useful improvement loop looks like this:
| Step | What Happens | Plant-Floor Output |
|---|---|---|
| Detect | AI, vision, or analytics flags a loss pattern | Defect, drift, downtime risk, or yield issue |
| Confirm | Operator, QA, or maintenance checks the evidence | True issue, false alarm, or watch item |
| Act | Team adjusts, repairs, holds, cleans, or escalates | Documented response |
| Verify | Results are checked after the action | Loss reduced or issue still active |
| Standardize | Work instruction, PM, recipe, or control limit is updated | Improvement sticks |
The last step is where many plants lose value.
If the system finds the same issue every week and the standard never changes, the pilot has become an expensive notification tool.
Use AI to shorten the path from signal to action to standard work.
11. Measure Success With Plant Metrics, Not Model Scores
A model score does not prove plant value.
The pilot should improve a number the plant already manages, without pushing the loss somewhere else.
Define the scorecard before launch.
| Decision Area | Go Signal | Pause Signal |
|---|---|---|
| OEE | Availability, performance, or quality improves without shifting losses | One metric improves while another gets worse |
| Downtime | Stops reduce, recovery improves, or intervention happens earlier | Alerts do not lead to action |
| Yield | Scrap, rework, giveaway, or hold time decreases | False rejects create new waste |
| Labour | Work is removed, redeployed, or made safer | Labour shifts into review or troubleshooting |
| QA | Decisions become faster and easier to verify | Exceptions increase without clear disposition |
| Maintenance | Emergency calls reduce or PMs improve | Specialized support burden increases |
| Sanitation | No meaningful added burden or risk | Cleaning becomes slower or harder |
| ROI | Payback is credible using real data | Savings depend on assumptions |
Set thresholds before anyone becomes attached to the project.
Examples:
- Reduce unplanned downtime on the target asset by 10 to 15 percent
- Cut false rejects below an agreed rate by SKU family
- Reduce manual inspection time by a defined number of hours per week
- Lower giveaway by a measurable amount per production run
- Reduce QA hold investigation time by a set percentage
- Keep added sanitation time below an agreed limit
- Achieve payback within the plant’s capital threshold
Use real baselines.
Baseline long enough to capture product mix, shift variation, sanitation cycles, planned maintenance, and changeovers. For many plants, that means weeks, not days.
Normalize the result, too.
If the pilot ran during easier SKUs, with stronger operators, fewer changeovers, or lower volume, the benefit may look better than it is. If it ran during an unusually difficult period, the benefit may be understated.
Compare like with like where possible.
A practical method is to track the pilot line against a similar line or product family that did not receive the system. It will not be perfect, but it helps separate actual improvement from normal plant variation.
12. Scale the Support Model Before Scaling the Technology
Scaling is not copying the same model from Line 1 to Line 2.
The second line may have a different PLC, lighting condition, sanitation routine, packaging supplier, reject device, downtime coding habit, operator skill mix, or maintenance access issue.
Even the same SKU can behave differently on another line.
Treat scale-up like an engineering change.
Before rollout, define what must be revalidated.
| Scaling Area | What to Check |
|---|---|
| Controls | PLC logic, triggers, permissives, fault handling, reject timing |
| Product | SKU mix, package format, allergen sequence, product variation |
| Equipment | Asset age, mechanical condition, tooling, conveyor layout |
| Data | Tag names, timestamps, historian quality, batch context |
| QA | Acceptance criteria, defect categories, hold and release workflow |
| Sanitation | Washdown exposure, teardown steps, pre-op inspection |
| Maintenance | Spares, access, calibration, troubleshooting skills |
| People | Operator training, supervisor ownership, escalation path |
A scale package should include:
- Current-state baseline
- Validated use case and limits
- Network and data map
- Model or recipe version history
- QA acceptance criteria
- Sanitation instructions
- Operator standard work
- Maintenance PMs and spare parts
- Troubleshooting guide
- Revalidation triggers
- Benefits tracking method
Name owners, not just sponsors.
Sponsors approve funding. Owners keep the system running.
Before scaling, answer these questions:
- Who approves a threshold change?
- Who reviews false rejects?
- Who checks camera focus after maintenance?
- Who updates the model when SKUs change?
- Who backs up the configuration?
- Who supports cybersecurity patches?
- Who confirms the system after sanitation or mechanical work?
A pilot is not ready to scale just because it works on one line.
It is ready when the plant can support it without relearning every lesson the hard way.
13. Use a Scale, Extend, or Pause Decision at the End
Not every pilot deserves rollout.
That is not failure. It is disciplined capital planning.
At the end of the pilot, use three possible decisions.
| Decision | When to Use It | Next Step |
|---|---|---|
| Scale | Value is proven, support is ready, and risks are controlled | Roll out with a standard package |
| Extend | Value is promising, but evidence is incomplete | Test more SKUs, shifts, edge cases, or operating states |
| Pause | Value is weak, support burden is high, or risk is unclear | Fix root cause, data, workflow, or design before continuing |
Pause when the technology works but the plant is not ready.
That may mean the use case is valid, but the data is not strong enough. It may mean the equipment needs a mechanical fix first. It may mean the system detects the right issue, but the workflow creates too much review burden for QA or maintenance.
It is better to pause a fragile pilot than scale complexity.
The best automation decisions are not always the fastest ones. They are the ones the plant can operate, clean, maintain, verify, and defend.
Build the Pilot Around the Production System
AI, robotics, machine vision, and analytics can create real value in food and beverage plants.
But the value does not come from the model alone.
It comes from the production system around it: the use case, data, integration, sanitation design, QA record, operator response, maintenance support, and measurement plan.
Before investing, ask one practical question:
If this system is right, wrong, dirty, out of calibration, offline, challenged by a new SKU, or questioned during an audit, does the plant know what to do?
If the answer is yes, the pilot has a real chance.
If the answer is no, the next step is not more technology. It is better readiness.
That is how AI becomes useful on the production floor: not as a separate experiment, but as a supported plant asset that improves decisions, reduces loss, and gives teams clearer evidence when it matters.